My general advice is to compute as much as possible before plotting, or in other words, try to limit the plotting to pure plotting, and not embed computations via things like stat_summary as much as possible. While its certainly possible to embed the computations, I find that its inelegant and harder to reason about. My advice is akin to more generic programming advice to break down large complicated code into smaller modules / functions.
That said, here is how I would approach the task. I assume finis is provided as in the above posts. I load library(tidyverse) (rather than load stringr ggplot2 and now dplyr separately).
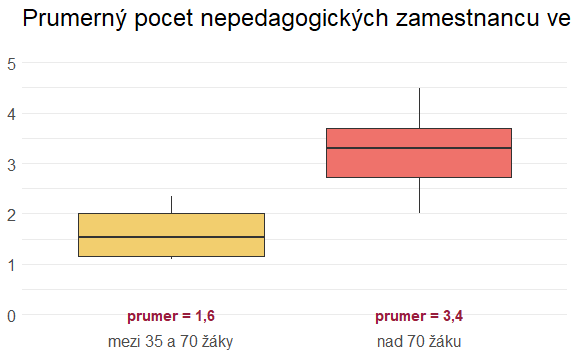
(mean_smry_df <- finis |> group_by(tercil_MS) |> summarise(mean_y=mean(pocet_pracovniku),
                                                           label_txt = str_c("průměr = ", str_replace(string = round(mean_y,1),
                                                                                                      pattern = "\\.",
                                                                                                      replacement = ","))))

ggplot(finis, aes(x = tercil_MS, y = pocet_pracovniku, fill = tercil_MS,
                  group = tercil_MS)) +
  geom_boxplot() +
  scale_fill_manual(values = c("#F2CE6E", "#EF726B","#74496B", "#67A88F")) +
  theme_minimal() +
  theme(legend.position = 'none',
        legend.title = element_blank(),
        text = element_text(size = 15, family = "Fira Sans Condensed"),
        plot.title = element_text(margin = margin(0,0,15,0)),
        axis.title.x = element_blank(),
        axis.title.y = element_blank(),
        panel.spacing = unit(2, "lines"),
        panel.grid.major.x = element_blank()
  ) +
  scale_y_continuous(label = scales::comma_format(accuracy = 1,
                                                  scale = 1,
                                                  prefix = "",
                                                  suffix = "",
                                                  big.mark = " ",
                                                  decimal.mark = ","),
                     limits = c(0,5)) +
  ggtitle("Průměrný počet nepedagogických zaměstnanců ve veřejných MŠ") +
  geom_text(data=mean_smry_df,
            mapping=aes(x=tercil_MS,
                        y=0,
                        label=label_txt),fontface = "bold", color = "#981E3D")