Does this work for you?
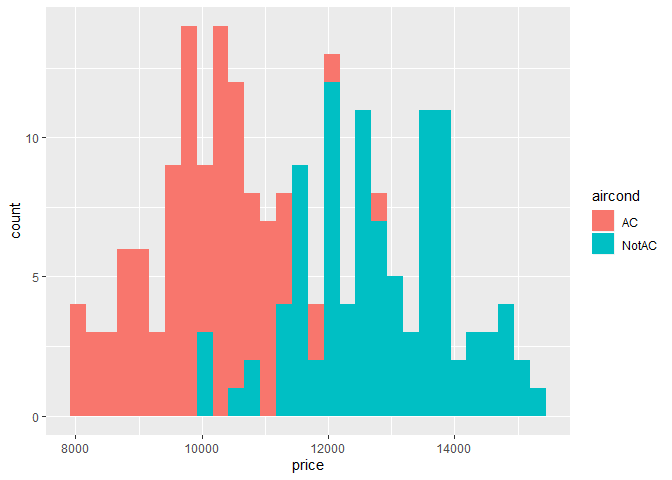
house <- data.frame(price = c(rnorm(100,10000,1000), rnorm(100,13000, 1200)),
                    aircond = c(rep("AC", 100), rep("NotAC", 100)))
library(ggplot2)
ggplot(house, aes(x =price, fill = aircond))+geom_histogram()
#> `stat_bin()` using `bins = 30`. Pick better value with `binwidth`.
Created on 2020-03-18 by the reprex package (v0.3.0)