You can also use the tag label
library(ggplot2)
library(gapminder)
data(gapminder, package = 'gapminder')
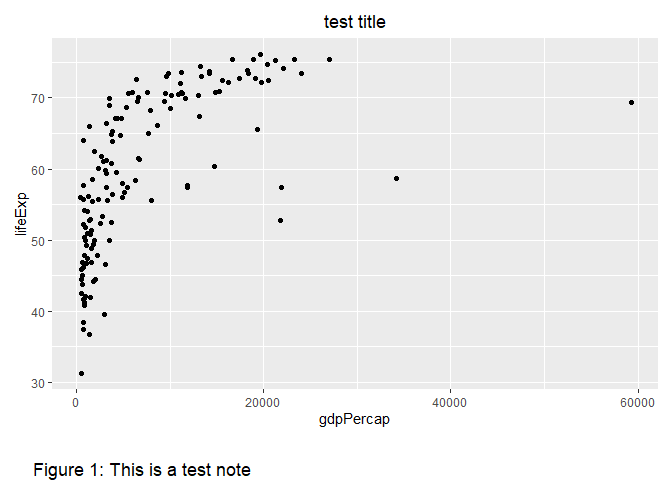
ggplot(subset(gapminder, year %in% 1977), aes(gdpPercap, lifeExp)) +
geom_point() +
labs(title = "test title",
tag = "Figure 1: This is a test note") +
coord_cartesian(clip = "off") +
theme(plot.title = element_text(hjust = 0.5),
plot.margin = margin(t = 10, r = 10, b = 40, l = 10),
plot.tag.position = c(0.2, -0.1)
)
Created on 2019-09-29 by the reprex package (v0.3.0)