Hi, and welcome!
The error indicates that the desired plot won't fit within the constraints of the graphics window.
You can check your syntax with the help example:
pairs(iris[1:4], main = "Anderson's Iris Data -- 3 species",
      pch = 21, bg = c("red", "green3", "blue")[unclass(iris$Species)])
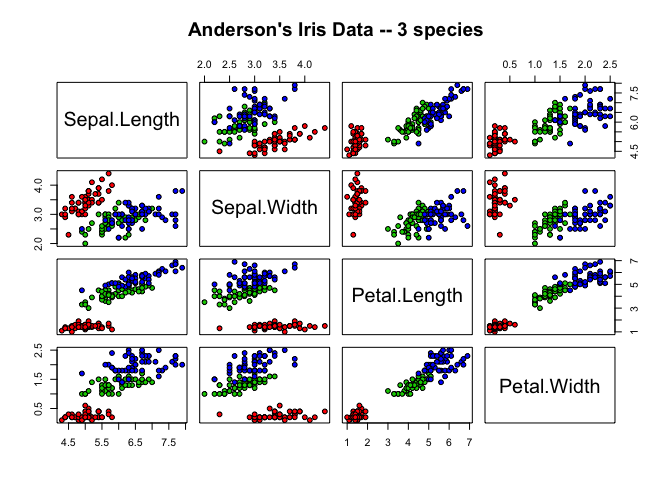
Created on 2020-01-11 by the reprex package (v0.3.0)
By the way, the form of code example above, a reproducible example, called a reprex is very helpful in attracting answers. It wasn't strictly necessary for your problem, but is something to keep in mind.
pairs() produces a matrix of scatterplots internally, but I don't know of anyway to selectively plot them in increments.
However, the GGally package, may provide that ability. Here's an example of its ggpairs()
library(GGally)
#> Loading required package: ggplot2
#> Registered S3 method overwritten by 'GGally':
#>   method from
#>   +.gg   ggplot2
data(tips, package = "reshape")
pm <- ggpairs(tips)
pm
#> `stat_bin()` using `bins = 30`. Pick better value with `binwidth`.
#> `stat_bin()` using `bins = 30`. Pick better value with `binwidth`.
#> `stat_bin()` using `bins = 30`. Pick better value with `binwidth`.
#> `stat_bin()` using `bins = 30`. Pick better value with `binwidth`.
#> `stat_bin()` using `bins = 30`. Pick better value with `binwidth`.
#> `stat_bin()` using `bins = 30`. Pick better value with `binwidth`.
#> `stat_bin()` using `bins = 30`. Pick better value with `binwidth`.
#> `stat_bin()` using `bins = 30`. Pick better value with `binwidth`.
#> `stat_bin()` using `bins = 30`. Pick better value with `binwidth`.
#> `stat_bin()` using `bins = 30`. Pick better value with `binwidth`.
#> `stat_bin()` using `bins = 30`. Pick better value with `binwidth`.
#> `stat_bin()` using `bins = 30`. Pick better value with `binwidth`.
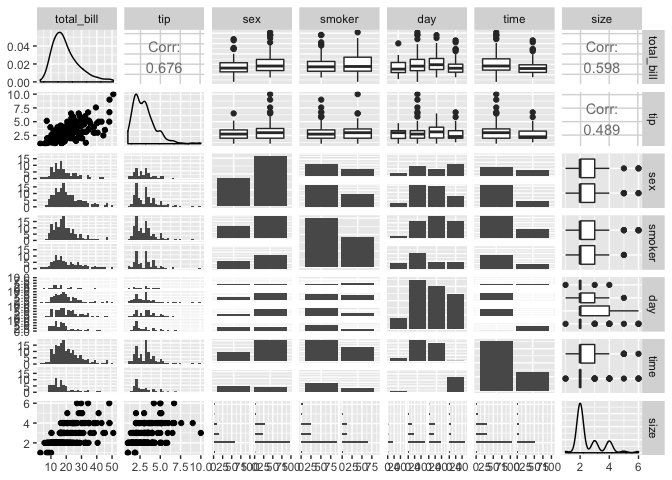
Created on 2020-01-11 by the reprex package (v0.3.0)