Are you looking for something like this?
library(ggplot2)
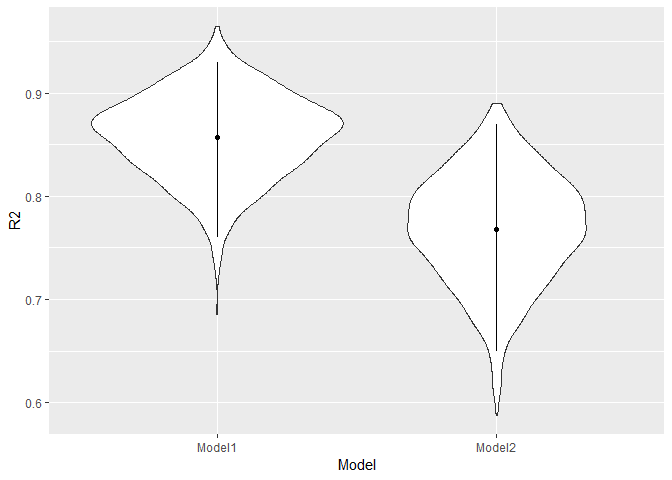
#simulate 1000 R2 values for each model
DF <- data.frame(Model = rep(c("Model1", "Model2"), each = 1000),
R2 = c(rbeta(1000,shape1 = 60,shape2 = 10 ),
rbeta(1000,shape1 = 50,shape2 = 15 )))
#Make a data frame with the mean R2 and invent confidence intervals
Stats <- data.frame(Model = c("Model1", "Model2"), Avg = c(0.857, 0.768),
UCL = c(0.93, 0.87), LCL = c(0.76, 0.65))
ggplot() + geom_violin(mapping = aes(x = Model, y = R2), data = DF) +
geom_point(mapping = aes(Model, Avg), data = Stats) +
geom_linerange(mapping = aes(x = Model, ymin = LCL, ymax = UCL), data = Stats)
Created on 2019-09-14 by the reprex package (v0.2.1)