Which file is it? There are several on that page. If it's GSE149189_CPM_FetusAdult_16623Gene.txt.gz then you have a problem, as this file is in CPM, while edgeR expects raw counts.
Even if I use this file (which I think is probably incorrect, as the dispersion estimates would expect counts not CPMs), and run the standard edgeR pipeline, I do get different results for the different comparisons:
library(edgeR)
#> Loading required package: limma
file <- read.delim("edger/GSE149189_CPM_FetusAdult_16623Gene.txt.gz")
head(file)
#> refGene Adult_DP_ELW30 Adult_DP_ELW33 Fetus_DP_ELW24 Fetus_DP_ELW26
#> 1 A1BG 3.582839 0.7214397 9.9376498 19.706386
#> 2 A1BG-AS1 1.016029 0.3091884 0.3078033 1.140896
#> 3 A2M 243.312184 142.3297450 0.5276628 3.111535
#> 4 A2M-AS1 4.973194 1.9581935 11.3887225 55.852046
#> 5 A4GALT 2.406384 0.8245025 0.0000000 0.000000
#> 6 A4GNT 0.267376 7.7297110 0.0000000 0.000000
#> Fetus_DSC_ELW25 Fetus_DSC_ELW27 Fetus_IFD_ELW28 Fetus_IFD_ELW29
#> 1 20.161231 2.237523 10.4269245 12.603857
#> 2 0.000000 0.000000 0.4787874 1.018004
#> 3 674.936597 409.466646 399.8406358 726.321502
#> 4 3.070648 1.398452 4.5750791 6.980598
#> 5 1.333308 1.678142 10.7993147 2.860106
#> 6 0.000000 9.901038 0.0000000 0.000000
group<- factor(c(1,1,2,2,3,3,4,4))
d <- DGEList(counts=file[,2:9], genes=file[1], group = factor(group))
d <- estimateDisp(d)
#> Using classic mode.
et12 <- exactTest(d, pair=c(1,2))
et13 <- exactTest(d, pair=c(1,3))
topTags(et12)
#> Comparison of groups: 2-1
#> refGene logFC logCPM PValue FDR
#> 9124 MXRA5 6.117027 9.910775 3.225688e-23 5.362062e-19
#> 5475 GPX3 -9.425870 7.383168 2.528134e-18 2.041859e-14
#> 4956 FST 5.533198 7.576499 4.878097e-18 2.041859e-14
#> 6446 ITGBL1 -8.144565 6.991279 5.176242e-18 2.041859e-14
#> 9021 MT1X -7.208880 6.847090 6.484258e-18 2.041859e-14
#> 11243 PRUNE2 -10.105939 7.067758 7.370003e-18 2.041859e-14
#> 8586 MGP -11.073128 9.126894 9.023969e-18 2.142935e-14
#> 4840 FLT1 -6.610540 7.131759 5.337540e-17 1.109074e-13
#> 3045 CSMD2 5.428040 7.642013 7.124004e-17 1.315804e-13
#> 9587 NNAT 5.950003 7.196916 1.290302e-16 2.144870e-13
topTags(et13)
#> Comparison of groups: 3-1
#> refGene logFC logCPM PValue FDR
#> 8536 MFAP5 9.993961 8.748015 1.572534e-32 2.614023e-28
#> 9124 MXRA5 6.739589 9.910775 1.085525e-26 9.022339e-23
#> 12276 RSPO4 -7.422496 8.736637 4.890468e-25 2.709809e-21
#> 2815 COL1A1 5.711712 15.092326 3.848710e-24 1.599428e-20
#> 3504 DIO3 -9.453647 7.274561 9.289976e-22 3.088545e-18
#> 13156 SLIT3 5.162058 9.778351 2.265243e-21 6.275856e-18
#> 5633 H19 7.567419 7.234105 3.136139e-21 7.447433e-18
#> 11091 PRELP 7.058215 8.144082 7.485624e-21 1.555419e-17
#> 5688 HBG2 10.221019 8.503723 3.053392e-20 5.193196e-17
#> 91 ABI3BP 7.385684 8.256799 3.124103e-20 5.193196e-17
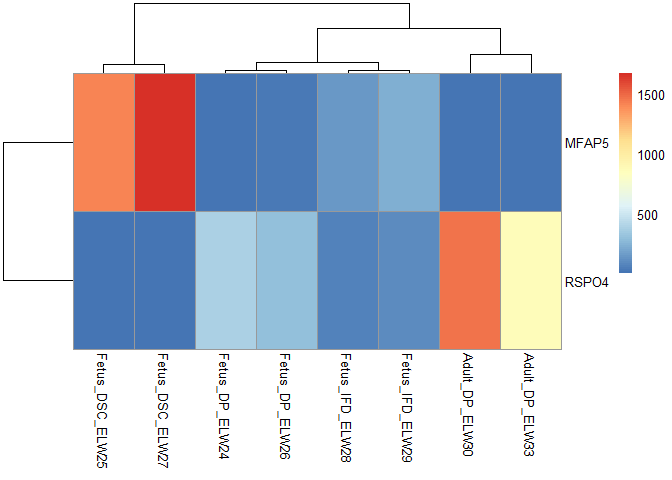
xx <- as.matrix(file[,2:9])
rownames(xx) <- file[,1]
pheatmap::pheatmap(xx[c("MFAP5","RSPO4"),])
Created on 2022-11-03 by the reprex package (v2.0.1)
So it is unclear to me what exactly you did, could you provide the exact code that you're running, ideally as a reprex?