From your comment I understand that you are trying to annotate your plot with those boxes instead of actually plotting data, if that is the case then this approach would be more natural.
Note: Please make your questions providing a self-contained REPRoducible EXample (reprex) like the one shown bellow.
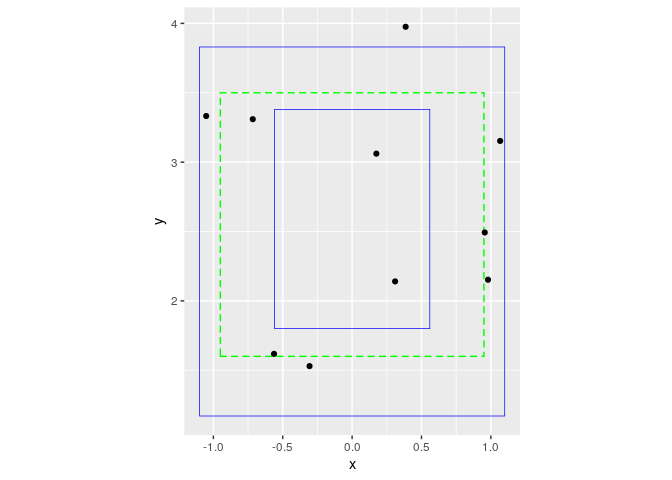
OShdwIn <- -1.1
OShdwOut <- 1.1
IShdwIn <- -0.56
IShdwOut <- 0.56
topKzone <- 3.5
botKzone <- 1.6
inKzone <- -0.95
outKzone <- 0.95
OShdwTop <- 3.83
IShdwtop <- 3.38
IShdBot <- 1.8
OShdBot <- 1.17

library(tidyverse)

set.seed(1)

sample_data <- data.frame(
    x = runif(10, -1.2, 1.2),
    y = runif(10, 1, 4)
)

sample_data %>%
    ggplot(aes(x, y)) +
    annotate("rect", xmin = OShdwIn, xmax = OShdwOut, ymin = OShdBot, ymax = OShdwTop,
             alpha = 0,
             color = "blue",
             lwd = .25) +
    annotate("rect", xmin = IShdwIn, xmax = IShdwOut, ymin = IShdBot, ymax = IShdwtop,
             alpha = 0,
             color = "blue",
             lwd = .25) +
    annotate("rect", xmin = inKzone, xmax = outKzone, ymin = botKzone, ymax = topKzone,
             alpha = 0,
             color = "green",
             lwd = .5,
             linetype = 2) +
    geom_point() +
    coord_equal()
Created on 2019-08-11 by the reprex package (v0.3.0.9000)