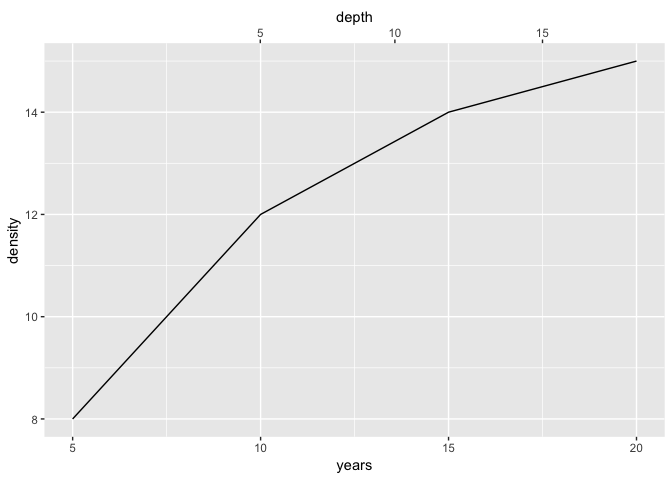
I wrote a package to do just this (among other things)! The tidypaleo package will let you create a dual age/depth axis in ggplot2 (although the axis will appear on the other side of the plot).
library(ggplot2)
# remotes::install_github("paleolimbot/tidypaleo")
library(tidypaleo)

test_data <- tibble::tribble(
  ~depth, ~years, ~density,
      1,      5,        8,
      5,     10,       12,
     12,     15,       14,
     18,     20,       15
)

# create an age-depth model using tidypaleo::age_depth_model()
model <- age_depth_model(
  depth = test_data$depth,
  age = test_data$years
)

# use scale_x_age_depth() to create the second axis
ggplot(test_data, aes(x = years, y = density)) +
  geom_line() +
  scale_x_age_depth(model, depth_name = "depth")
Created on 2019-04-03 by the reprex package (v0.2.1)
It's possible to do this manually as well using sec_axis(), but it is complicated enough that using age_depth_model() is probably your best bet. Another option would be to use a geom_text() and/or geom_vline() to put the age and/or depth information on the plot directly.