Hi, can you provide a reproducible example?
An example of something similar using default data is:
library(ggplot2)
dplyr::glimpse(iris)
#> Rows: 150
#> Columns: 5
#> $ Sepal.Length <dbl> 5.1, 4.9, 4.7, 4.6, 5.0, 5.4, 4.6, 5.0, 4.4, 4.9, 5.4, 4.~
#> $ Sepal.Width <dbl> 3.5, 3.0, 3.2, 3.1, 3.6, 3.9, 3.4, 3.4, 2.9, 3.1, 3.7, 3.~
#> $ Petal.Length <dbl> 1.4, 1.4, 1.3, 1.5, 1.4, 1.7, 1.4, 1.5, 1.4, 1.5, 1.5, 1.~
#> $ Petal.Width <dbl> 0.2, 0.2, 0.2, 0.2, 0.2, 0.4, 0.3, 0.2, 0.2, 0.1, 0.2, 0.~
#> $ Species <fct> setosa, setosa, setosa, setosa, setosa, setosa, setosa, s~
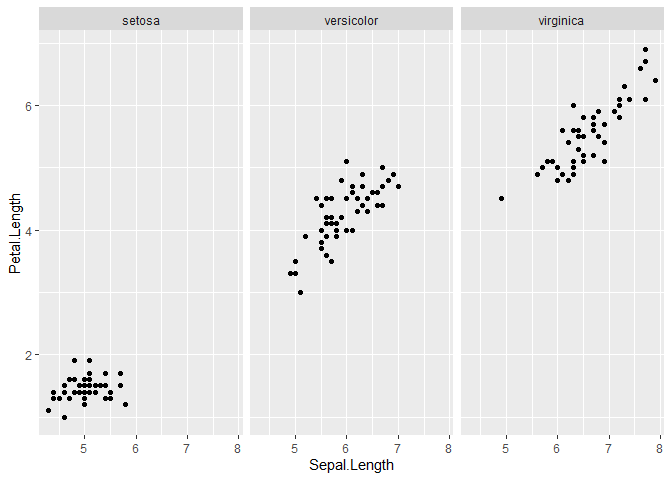
ggplot(iris, aes(Sepal.Length, Petal.Length)) +
geom_point() +
facet_wrap(~Species)
Created on 2021-12-20 by the reprex package (v2.0.1)