I'll start you off. You need to decide what types of visualizations you want for each variable, and to research the R syntax for those visualizations.
df <- read.table("C:/Users/Jerry/Desktop/R_files/cleaned_kidney_dataset.txt",
sep=',' , header=TRUE)
head(df)
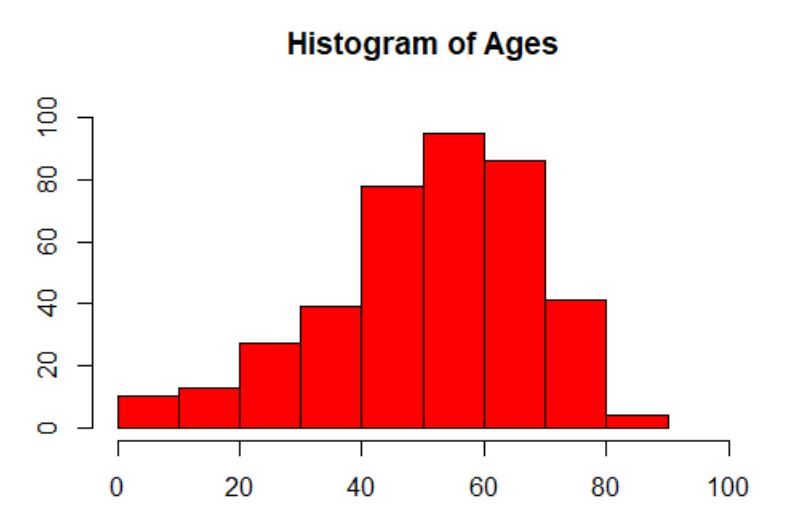
hist(df$age,
breaks=10,
xlim=c(0,100),
col="red",
border="black",
ylim=c(0,100),
xlab="age",
ylab="Counts",
main="Histogram of Ages")