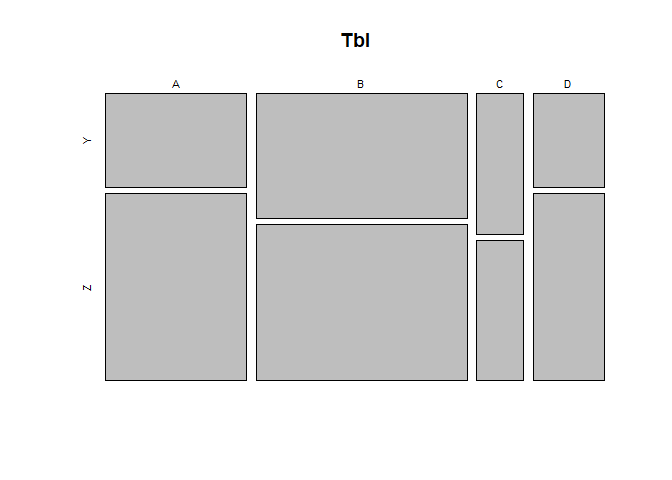
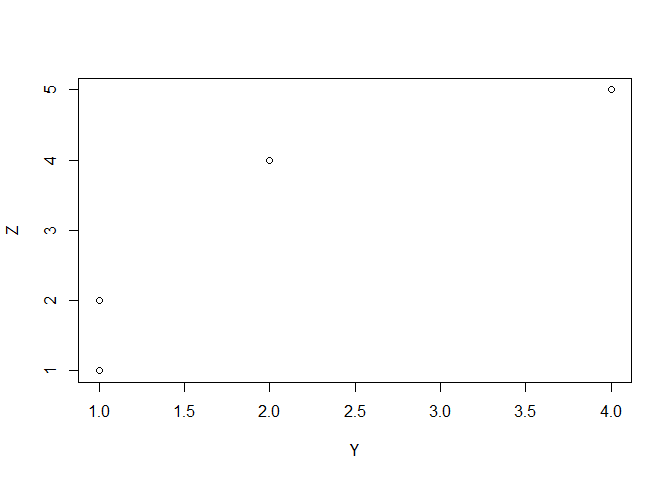
I guess it depends on what you mean by "just an array". It is basically an array but, having been given the class "table", it is handled differently by functions which have a method dedicated to tables, like plot(). The table and the matrix in the example below contain the same values and have the same dimension names but result in different plots.
set.seed(35412)
df <- data.frame(X = sample(LETTERS[1:4], 20, replace = TRUE),
                 Y = sample(LETTERS[25:26], 20, replace = TRUE))

Tbl <- table(df$X, df$Y)
Tbl
#>
#>     Y Z
#>   A 2 4
#>   B 4 5
#>   C 1 1
#>   D 1 2

str(Tbl)
#>  'table' int [1:4, 1:2] 2 4 1 1 4 5 1 2
#>  - attr(*, "dimnames")=List of 2
#>   ..$ : chr [1:4] "A" "B" "C" "D"
#>   ..$ : chr [1:2] "Y" "Z"
plot(Tbl)
MAT <- matrix(c(2,4,1,1,4,5,1,2), nrow = 4)

dimnames(MAT) <- list(c("A", "B", "C", "D"), c("Y", "Z"))
MAT
#>   Y Z
#> A 2 4
#> B 4 5
#> C 1 1
#> D 1 2
str(MAT)
#>  num [1:4, 1:2] 2 4 1 1 4 5 1 2
#>  - attr(*, "dimnames")=List of 2
#>   ..$ : chr [1:4] "A" "B" "C" "D"
#>   ..$ : chr [1:2] "Y" "Z"
plot(MAT)
Created on 2019-03-12 by the reprex package (v0.2.1)