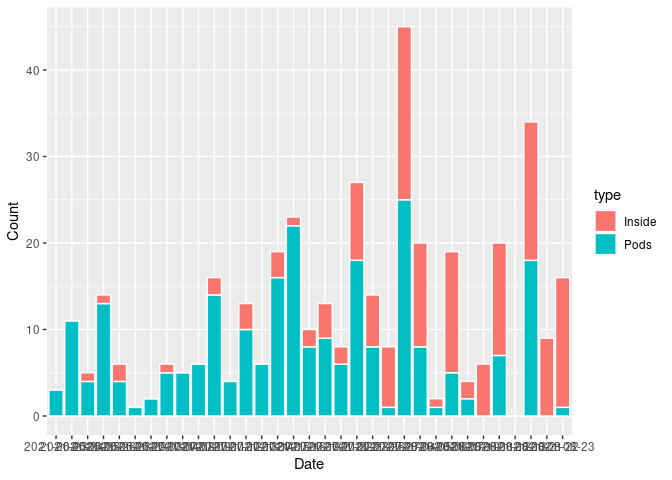
Is this what you mean? I think you want a column plot instead of a histogram (since you are using stat = identity)
library(tidyverse)

PodsBoth <- data.frame(
        Date = c("2021-06-23","2021-06-24","2021-06-25",
                 "2021-06-26","2021-06-28","2021-06-29","2021-07-03",
                 "2021-07-04","2021-07-08","2021-07-09","2021-07-11","2021-07-12",
                 "2021-07-13","2021-07-14","2021-07-15","2021-07-16",
                 "2021-07-19","2021-07-21","2021-07-22","2021-07-23","2021-07-26",
                 "2021-07-27","2021-08-04","2021-08-05","2021-08-06",
                 "2021-08-07","2021-08-10","2021-08-11","2021-08-12","2021-08-13",
                 "2021-08-21","2021-08-22","2021-08-23"),
       Pods = c(3,11,5,14,6,1,2,6,5,6,16,4,13,
                 6,19,23,10,13,8,27,14,8,45,20,2,19,4,6,20,0,34,
                 9,16),
      Inside = c(0,0,1,1,2,0,0,1,0,0,2,0,3,0,3,
                 1,2,4,2,9,6,7,20,12,1,14,2,6,13,0,16,9,15)
)

PodsBoth %>%
    mutate(Pods = Pods - Inside) %>%
    pivot_longer(cols = c("Pods", "Inside"), names_to = "type", values_to = "Count") %>%
    ggplot(aes(x = Date, y=Count, fill = type)) +
    geom_col(color="white")
Created on 2021-08-30 by the reprex package (v2.0.1)