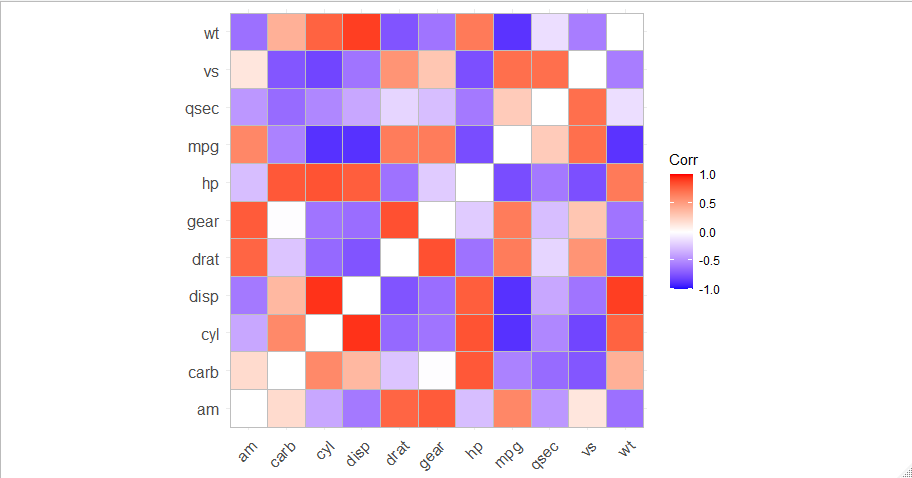
there's almost certainly a more elegant solution but this is what I came up with.
library(wCorr)
library(tidyverse)
library(ggcorrplot)

myweights <- mutate_all(mtcars, runif)
myvalues <- mtcars

to_do_list <- combn(names(mtcars),2,simplify = FALSE)
my_res<-purrr::map_dfr(to_do_list,
               ~tibble(var_row = .[[1]],
                      var_col = .[[2]],
                       wCorr = wCorr::weightedCorr(x = myvalues[[.[[1]]]],
                                                   y= myvalues[[.[[2]]]],
                                                   weights = myweights[[.[[1]]]] * myweights[[.[[2]]]],
                                                   method = "Pearson")))
vr<-enframe(names(mtcars),value="var_row")
vc<-enframe(names(mtcars),value="var_col")
v2 <- bind_cols(vr,vc) %>% select(var_row,var_col) %>% mutate(wCorr=0)
combined <-union_all(my_res,v2) %>% arrange(var_col,var_row)
# A tibble: 55 x 2
m<-pivot_wider(combined,
               names_from = var_col,
               values_from = wCorr) %>% arrange(var_row) %>% select(-var_row)

mm <- as.matrix(m)
rownames(mm) <- sort(names(mtcars))

for(i in 1:dim(mm)[[1]]){
  for (j in 1:dim(mm)[[2]]){
    if( is.na(mm[i,j])){

      mm[i,j]<-mm[j,i]
    }
  }
}

ggcorrplot(mm)