It would help if you could provide a reprex, and be more specific as to how the "shade" should vary.
Here is something like what you asked:
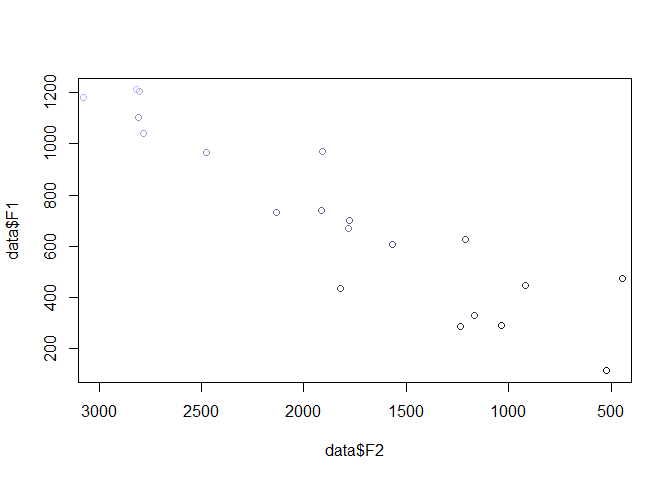
data <- data.frame(F1 = seq(from = 200, to = 1200, length.out = 20) + rnorm(20, sd = 100),
                   F2 = seq(from = 500, to = 3000, length.out = 20) + rnorm(20, sd = 300),
                   type = 1:20)

mycol <- hsv(h = .7, s = .3, v = (data$type)/max(data$type))

plot(data$F2, data$F1,
     xlim = c(3000,500),
     col = mycol)
Created on 2022-12-14 by the reprex package (v2.0.1)