Depending on your use case and format of your data you can either give each geom its own data like @jlacko showed, alternativly you can use the group aesthetic like this:
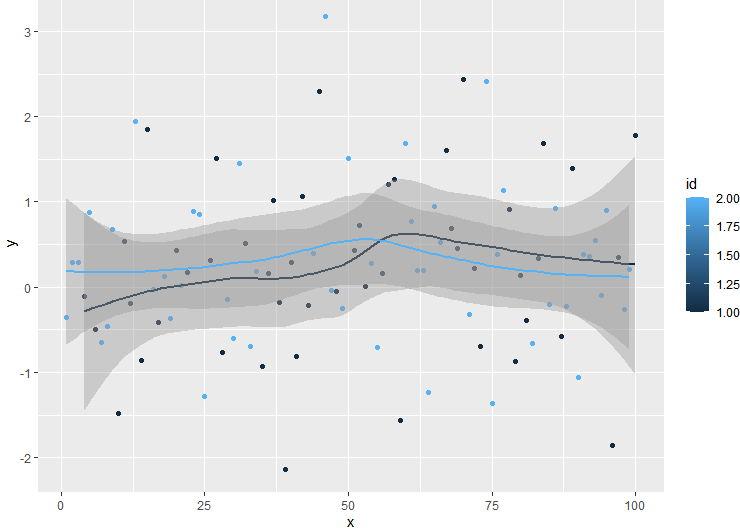
df <- data.frame(x = 1:100, y = rnorm(100) ,id= sample(1:2,100,replace = T))

ggplot(df,aes(x,y,,color = id, group = id)) + geom_point() + geom_smooth()