Hi @fitzer23!
Here are two different ways to get the layout I think you're looking for. They differ mostly in whether the overall layout starts with a row or with columns, and in whether the four small plots are arranged by rows or by columns. There are more variations possible depending on how nested you want things to be, but hopefully these can get you started.
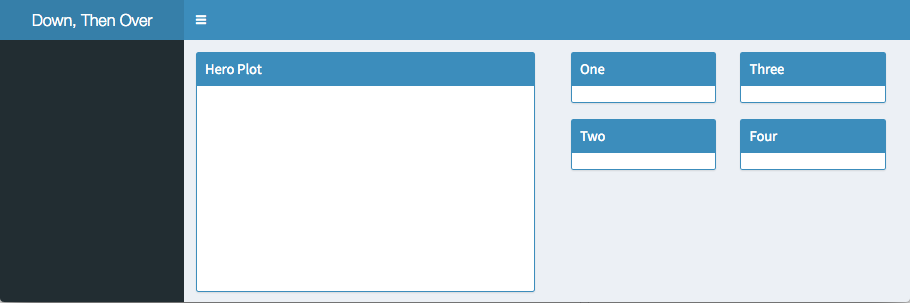
Row-based main layout, small plots column-wise
library(shiny)
library(shinydashboard)

body_colwise <- dashboardBody(
  fluidRow(
    box(width = 6, height = '300px', solidHeader = TRUE, status = "primary",
        title = "Hero Plot"
        #Plot
    ),

    column(width = 6,
           column(width = 6,
                  box(width = NULL, solidHeader = TRUE, status = "primary",
                      title = "One"
                      #Plot
                  ),
                  box(width = NULL, solidHeader = TRUE, status = "primary",
                      title = "Two"
                      #Plot
                  )
           ),
           column(width = 6,
                  box(width = NULL, solidHeader = TRUE, status = "primary",
                      title = "Three"
                      #Plot
                  ),
                  box(width = NULL, solidHeader = TRUE, status = "primary",
                      title = "Four"
                      #Plot
                  )
           )
    )
  )
)

ui <- dashboardPage(
  dashboardHeader(title = "Down, Then Over"),
  dashboardSidebar(),
  body_colwise
)

# Preview the UI in the console
shinyApp(ui = ui, server = function(input, output) { })
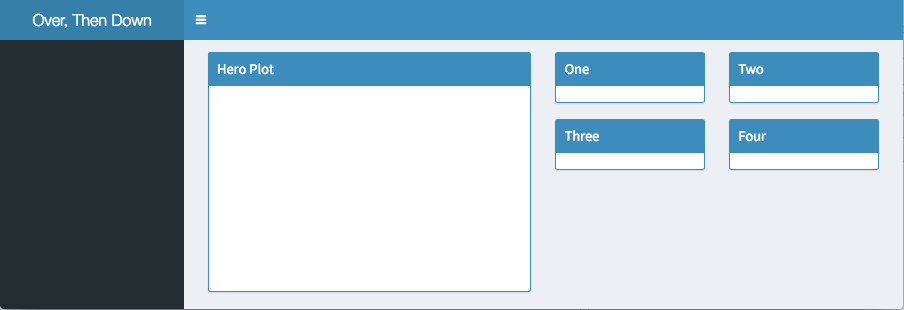
Column-based main layout, small plots row-wise
library(shiny)
library(shinydashboard)

body_rowwise <- dashboardBody(
  column(width = 6,
         box(width = NULL, height = '300px', solidHeader = TRUE, status = "primary",
             title = "Hero Plot"
             #Plot
         )
  ),

  column(width = 6,
         fluidRow(
           box(width = 6, solidHeader = TRUE, status = "primary",
               title = "One"
               #Plot
           ),
           box(width = 6, solidHeader = TRUE, status = "primary",
               title = "Two"
               #Plot
           )
         ),
         fluidRow(
           box(width = 6, solidHeader = TRUE, status = "primary",
               title = "Three"
               #Plot
           ),
           box(width = 6, solidHeader = TRUE, status = "primary",
               title = "Four"
               #Plot
           )
         )
  )
)

ui <- dashboardPage(
  dashboardHeader(title = "Over, Then Down"),
  dashboardSidebar(),
  body_rowwise
)

# Preview the UI in the console
shinyApp(ui = ui, server = function(input, output) { })
Some points that might be helpful in working this kind of thing out in the future:
-
box()es inside acolumn()need to havewidth = NULL, otherwise they'll be wrapped inside another columndiv. -
You can use the console to preview the basic HTML skeleton that a series of
fluidRow()s,column()s, andbox()es will create, for example:> fluidRow( + box(width = 6), + column(width = 6, + box(width = NULL) + ) + ) <div class="row"> <div class="col-sm-6"> <div class="box"> <div class="box-body"></div> </div> </div> <div class="col-sm-6"> <div> <div class="box"> <div class="box-body"></div> </div> </div> </div> </div> -
Supplying a small, self-contained, reproducible example makes it easier for people to jump in and help, which also makes you more likely to get answers faster
 .
.