oui<-c(5/11,2/6,6/10,4/5,7/13,12/15,11/12,3/3,4/4,1/1,2/2,3/3,12/12,10/10)
non<-c(6/11,4/6,4/10,1/5,6/13,3/15,1/12,0/3,0/4,0/1,0/2,0/3,0/12,0/10)
df<-data.frame(oui,non)
df<-round(x*100,2)
#> Error in eval(expr, envir, enclos): object 'x' not found
name=c("Certification", "Domaine application", "Termes et définitions",
"Exigences SME", "Politique environnementale", "Planification",
"Mise en oeuvre et fonctionnement", "Communication", "Documentation",
"Maitrise documentation", "Maitrise opérationnelle", "Situation urgence",
"Contrôle", "Revue de direction")
df$name <- name
df
#> oui non name
#> 1 0.4545455 0.54545455 Certification
#> 2 0.3333333 0.66666667 Domaine application
#> 3 0.6000000 0.40000000 Termes et définitions
#> 4 0.8000000 0.20000000 Exigences SME
#> 5 0.5384615 0.46153846 Politique environnementale
#> 6 0.8000000 0.20000000 Planification
#> 7 0.9166667 0.08333333 Mise en oeuvre et fonctionnement
#> 8 1.0000000 0.00000000 Communication
#> 9 1.0000000 0.00000000 Documentation
#> 10 1.0000000 0.00000000 Maitrise documentation
#> 11 1.0000000 0.00000000 Maitrise opérationnelle
#> 12 1.0000000 0.00000000 Situation urgence
#> 13 1.0000000 0.00000000 Contrôle
#> 14 1.0000000 0.00000000 Revue de direction
library(tidyverse)
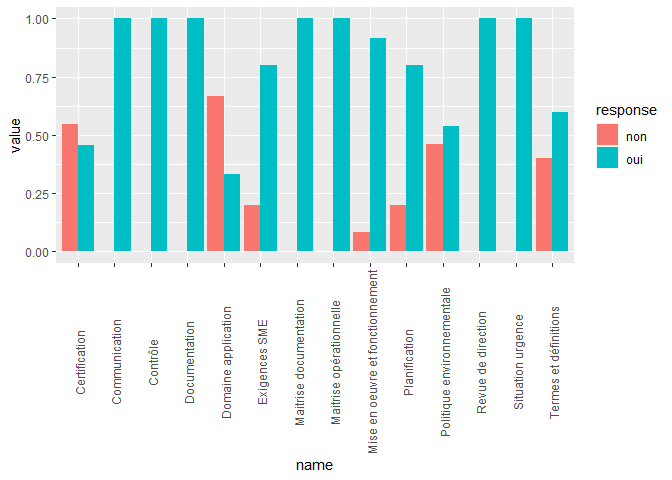
g <- df %>%
pivot_longer(-name, names_to = "response") %>%
ggplot() +
aes(name, value, fill = response) +
geom_bar(stat = "identity", position = "dodge")
g + theme(axis.text.x = element_text(angle = 90, vjust = .6))
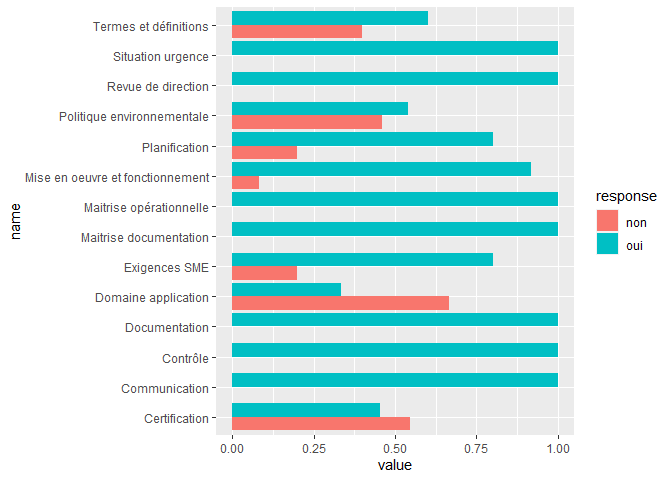
g + coord_flip()
Created on 2021-06-25 by the reprex package (v1.0.0)