Hi all,
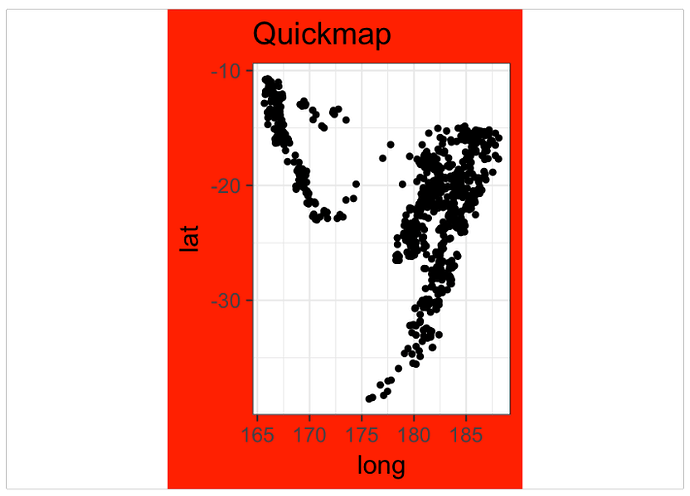
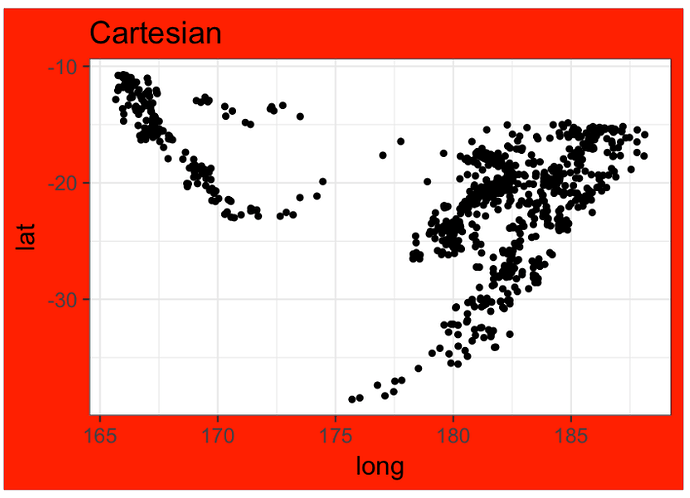
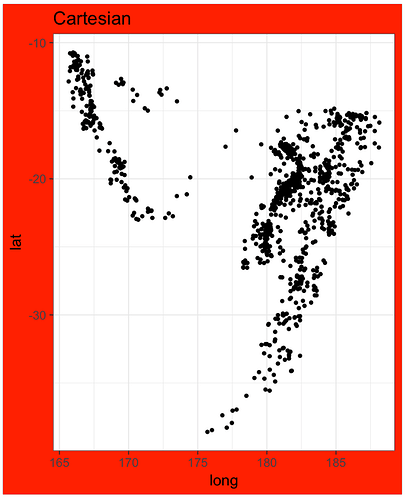
I found a workaround for the problem I outlined above. I use coord_quickmap to estimate the aspect ratio for the plot. With this information I define the the paper size. In the following example the paper width is fixed and the height is derived from the aspect ratio. Titles, legends need extra adjustments to the aspect ratio (see below). Finally, I use coord_cartesian to plot the graph which fills the paper (no blank space). There might be small distortions compared to coord_quickmap, but it suits the purpose pretty well.
Best, Matt
library(ggplot2)
library(gridExtra)
data("quakes")

dir.temp <- "~/Data/test"

dpi <- 144
plot.width <- 148 # Format DIN A6 landscape mm
plot.height <- 105 # Format DIN A6 landscape mm
base_size <- 16 # Points
aps.correction <- .9 # Scaling that accounts for spaced you by title

# Let coord_quickmap figure out the aspect ratio:
coord <- coord_quickmap(xlim = range(quakes$long), ylim = range(quakes$lat), expand = F)
asp <- coord$aspect(list(x.range = range(quakes$long), y.range = range(quakes$lat)))
asp
#> [1] 1.365346

# Calculate height
plot.height.new <- plot.width * asp * aps.correction

p.quickmap <- ggplot(quakes, aes(long, lat)) + geom_point() +
  coord_quickmap() + ggtitle("Quickmap") + theme_bw(base_size = base_size) +
  theme(plot.background = element_rect(fill = "red"))

p.cartesian <- ggplot(quakes, aes(long, lat)) + geom_point() +
  coord_cartesian() + ggtitle("Cartesian") + theme_bw(base_size = base_size) +
  theme(plot.background = element_rect(fill = "red"))

# Output
ggsave("p_quickmap.png", plot = p.quickmap, path = dir.temp, dpi = dpi,
  width = plot.width, height = plot.height, units = "mm")

ggsave("p_cartesian.png", plot = p.cartesian, path = dir.temp, dpi = dpi,
  width = plot.width, height = plot.height, units = "mm")

ggsave("p_cartesian_mod.png", plot = p.cartesian, path = dir.temp, dpi = dpi,
  width = plot.width, height = plot.height.new, units = "mm")
Created on 2018-06-11 by the reprex package (v0.2.0).


