The last working line of code you have gives:
par(mar = c(10,5,3,2),cex = 1.0)
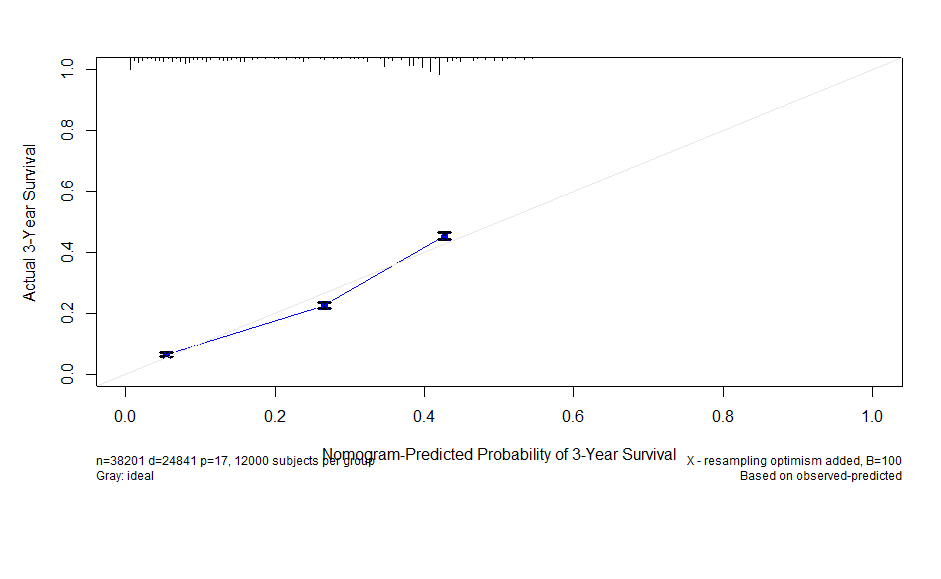
plot(cal,lwd=3,lty=2,errbar.col="black",xlim = c(0,1),ylim = c(0,1),xlab ="Nomogram-Predicted Probability of 3-Year Survival",ylab="Actual 3-Year Survival",col="blue")
its not exactly clear to me what you intended for
lines(cal,c('mean.predicted','KM'),type = 'a',lwd = 3,col ="black" ,pch = 16) #error comes after here
to do,
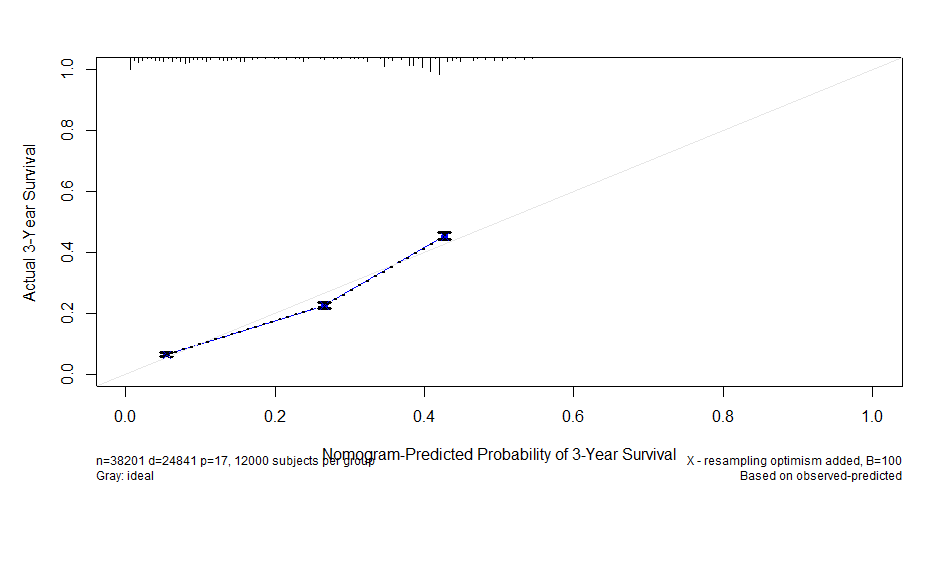
but this works and plots a dotted black line over the previous blue line
lines(cal[,'mean.predicted'],cal[,'KM'],lty=3,lwd = 2,col ="black" ,pch = 16)