Hi there,
I worked through your code and am a bit unsure what you're hoping for the final plot to look like, but I wonder if the following is at least a helpful starting point:
library(tidyverse)
# Reproducible df
ex_df <- tribble(
~A, ~B, ~C, ~D, ~E,
"Yes", "No", "No", 6, "No",
"Yes", "No", "No", 2, "Yes",
"No", "No", "No", 13, "Yes",
"Yes", "No", "No", 1, "Yes",
"No", "No", "No", 5, "Yes"
)
# Pivot to long format to allow for paneling
long_df <- ex_df %>%
pivot_longer(names_to = "x_vars", values_to = "x_values",
c(A, B, C))
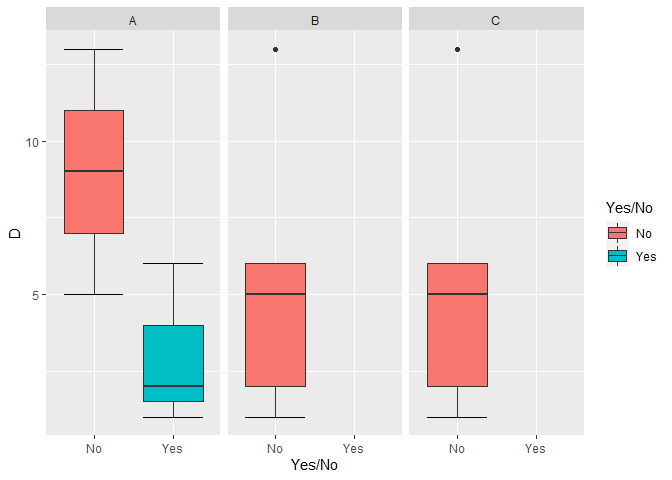
# Plot with panels
long_df %>%
ggplot() +
stat_boxplot(geom = "errorbar",
mapping = aes(x = x_values, y = D)) +
geom_boxplot(aes(x = x_values, y = D, fill = x_values)) +
facet_wrap(vars(x_vars)) +
xlab("Yes/No") +
scale_fill_discrete("Yes/No")
Created on 2021-07-26 by the reprex package (v2.0.0)
I'm not sure what the error bars should be showing. They don't seem right to me in this example, but perhaps you could clarify this and what you're hoping to do with a z-axis.
I used a "long" format data frame here to keep the variable relationships intact while plotting.