Hi @jacmac , and welcome!
The example you are sharing is not exactly reproducible (you know what is liable to happen to you for using path like C:/Users/Jac/Documents/ ? your ![]() on
on ![]() !!! ).
!!! ).
So just some general comments:
- you are creating two leaflet objects - map2020 and map2016; this is not how addLayersControl works; you are supposed to create two polygon layers in one leaflet object, and use the layers control to switch between them (via baseGroup = radio button behaviour) or turn each on and off (via overlayGroups = checkbox behaviour).
- while the
addLayersControlcall will work separately when used with a map as a first argument it is not a particularly good practice to do so; it is much better to attach it via pipe (%>%) to an existing leaflet pipeline.
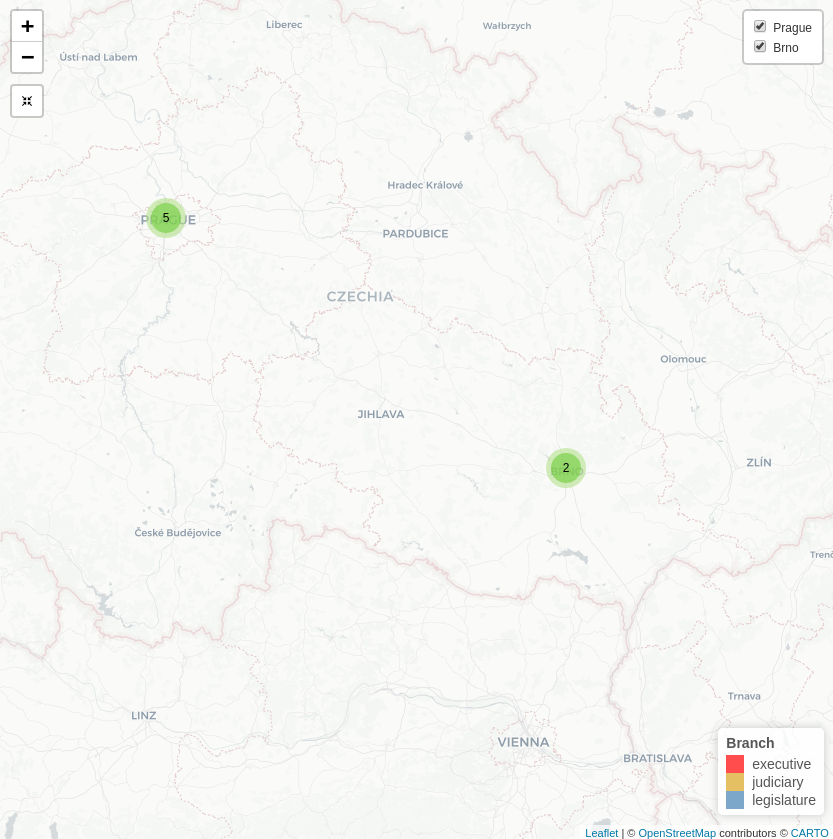
For an example of a reproducible layers control call consider this code, taken from my Leaflet in R walkhrough.
Note how two groups are defined in two separate addCircleMarkers calls (the rest of the map will remain the same) and how they are utilized in the addLayersControls.
For points it makes sense to add the groups one by one (checkbox like) but polygons will likely require radio button functrionality (baseGroups instead of overlayGroups)
library(sf)             # for working with spatial data
library(dplyr)          # data frame manipulation
library(leaflet)        # because leaflet :)
library(htmltools)      # tools to support html workflow
library(leaflet.extras) # extending the leaflet.js


# set up a data frame of points
body <- data.frame(name = c("Kramářova vila", "Pražský hrad", "Strakova akademie", "Nejvyšší soud", "Ústavní soud", "Sněmovna", "Senát"),
                   branch = c("executive", "executive", "executive", "judiciary", "judiciary", "legislature", "legislature"),
                   link = c("https://en.wikipedia.org/wiki/Kram%C3%A1%C5%99%27s_Villa",
                            "https://en.wikipedia.org/wiki/Prague_Castle",
                            "https://en.wikipedia.org/wiki/Straka_Academy",
                            "https://en.wikipedia.org/wiki/Supreme_Court_of_the_Czech_Republic",
                            "https://en.wikipedia.org/wiki/Constitutional_Court_of_the_Czech_Republic",
                            "https://en.wikipedia.org/wiki/Chamber_of_Deputies_of_the_Czech_Republic",
                            "https://en.wikipedia.org/wiki/Senate_of_the_Czech_Republic"),
                   lat = c(14.4104392, 14.3990089, 14.4117831, 16.6021958, 16.6044039, 14.4039458, 14.4053489),
                   lon = c(50.0933681, 50.0895897, 50.0920997, 49.2051925, 49.1977642, 50.0891494, 50.0900269))


# transform the data frame from plain vanilla one to spatial
body <- body %>%
  sf::st_as_sf(coords = c("lat", "lon"), # columns with geometry
               crs = 4326) # WGS84 is a sensible default...

# prepare a palette - manual colors according to branch column
palPwr <- leaflet::colorFactor(palette = c("executive" = "red",
                                           "judiciary" = "goldenrod",
                                           "legislature" = "steelblue"),
                               domain = body$branch)


# data frame or Prague points
praha <- body %>%
  dplyr::filter(branch != "judiciary") # a shortcut - all except judiciary are in Prague

# data frame of Brno points
brno <- body %>%
  filter(branch == "judiciary") # only judiciary happens to be in Brno (and only in Brno)

# first prepare a leaflet plot ...
lplot <- leaflet(data = body) %>% # data = original body - to get the zoom right
  addProviderTiles("CartoDB.Positron") %>%
  addCircleMarkers(data = praha, # first group
                   radius = 10,
                   fillOpacity = .7,
                   stroke = FALSE,
                   popup = ~htmlEscape(name),
                   color = palPwr(praha$branch), # using already created palette
                   clusterOptions = markerClusterOptions(),
                   group = "Prague") %>%
  addCircleMarkers(data = brno, # second group
                   radius = 10,
                   fillOpacity = .7,
                   stroke = FALSE,
                   popup = ~htmlEscape(name),
                   color = palPwr(brno$branch), # using already created palette
                   clusterOptions = markerClusterOptions(),
                   group = "Brno") %>%
  addLegend(position = "bottomright",
            values = ~branch,
            opacity = .7,
            pal = palPwr, # palette declared previously
            title = "Branch") %>%
  leaflet::addLayersControl(overlayGroups = c("Prague", "Brno"),
                   options = layersControlOptions(collapsed = FALSE)) %>%
  addResetMapButton()

lplot #  ... then display it