Use scale_y_reverse(), otherwise ggplot2 can't make sense of the specified scale limits.
library(tidyverse)
do_means_test <- tibble::tribble(
~site, ~depth_ft, ~month, ~mean_do,
"LP-2", 0L, "Apr", 9.696666667,
"LP-2", 0L, "Aug", 8.14,
"LP-2", 0L, "Dec", 11.05,
"LP-2", 0L, "Feb", 10.85,
"LP-2", 0L, "Jan", 10.23,
"LP-2", 0L, "Jul", 8.27,
"LP-2", 0L, "Jun", 8.545,
"LP-2", 0L, "Mar", 10.72,
"LP-2", 0L, "May", 8.645,
"LP-2", 0L, "Nov", 9.44,
"LP-2", 0L, "Oct", 8.476666667,
"LP-2", 0L, "Sep", 7.53,
"LP-2", 4L, "Apr", 9.673333333,
"LP-2", 4L, "Aug", 8.06,
"LP-2", 4L, "Dec", 10.89,
"LP-2", 4L, "Feb", 10.77,
"LP-2", 4L, "Jan", 10.18,
"LP-2", 4L, "Jul", 8.25,
"LP-2", 4L, "Jun", 8.39,
"LP-2", 4L, "Mar", 10.68,
"LP-2", 4L, "May", 8.645,
"LP-2", 4L, "Nov", 9.355,
"LP-2", 4L, "Oct", 8.35,
"LP-2", 4L, "Sep", 7.32
)
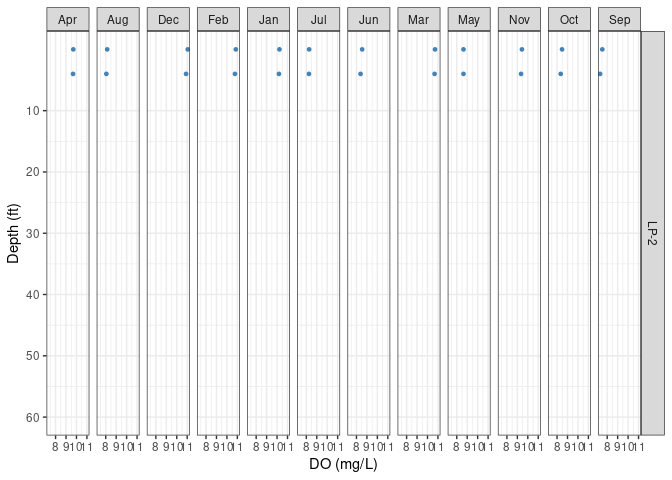
ggplot(data = do_means_test,
aes(x = mean_do,
y = depth_ft)) +
geom_point(color = "steelblue", size = 1) +
facet_grid(site ~ month) +
scale_y_reverse(limits = c(60L, 0L),
breaks = seq(60, 10, by = -10)) +
theme_bw() +
labs(x = "DO (mg/L)",
y = "Depth (ft)")
Created on 2022-03-01 by the reprex package (v2.0.1)
The "Ls" appear there to denote that those numbers are "integers"
Note: Next time please provide a proper REPRoducible EXample (reprex) illustrating your issue.