There is a more elegant solution mapping the color aesthetic to the Sample variable, I'm going to give you an example using a built-in data frame (since you haven't provided sample data).
library(ggplot2)
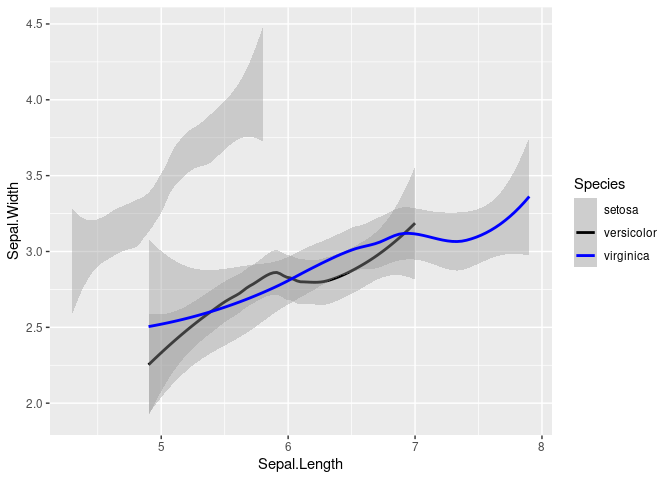
ggplot(data = iris, aes(x = Sepal.Length, y = Sepal.Width, color = Species)) +
geom_smooth() +
scale_color_manual(values = c("setoda" = "gray", "versicolor" = "black", "virginica" = "blue"))
#> `geom_smooth()` using method = 'loess' and formula 'y ~ x'
Created on 2021-03-07 by the reprex package (v1.0.0.9002)
If you need more specific help, please provide a proper REPRoducible EXample (reprex) illustrating your issue.