legend() is a base R function, you can't apply a base R function to a ggplot2 object. Is this what you want to achieve?
library(tidyverse)
# Sample data in a copy/paste friendly format, replace this with your own data frame
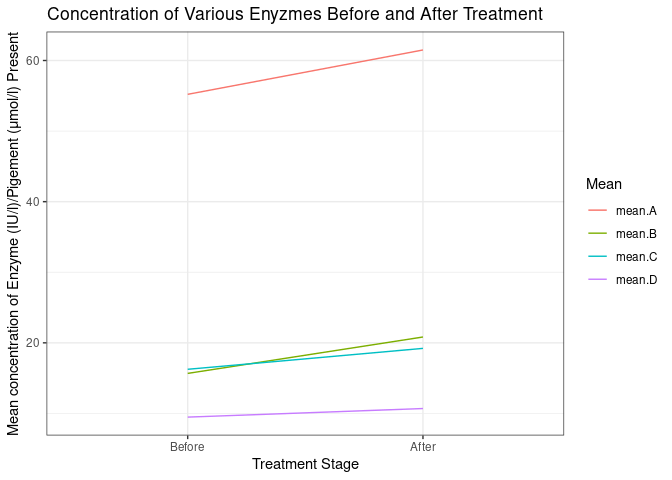
sample_df <- data.frame(
row.names = c("mean.A", "mean.B", "mean.C", "mean.D"),
before = c(55.207921, 15.669967, 16.250825, 9.475262),
after = c(61.49175, 20.82673, 19.21452, 10.69145)
)
# Relevant code
sample_df %>%
rownames_to_column(var = "Mean") %>%
ggplot() +
geom_segment(aes(x = 1L, xend = 2L, y = before, yend = after, col = Mean)) +
theme_bw() +
scale_x_discrete(
breaks = c(1, 2),
labels = c("Before", "After"),
limits = factor(c(1, 2))
) +
labs(y = "Mean concentration of Enzyme (IU/l)/Pigement (μmol/l) Present",
x = "Treatment Stage",
title = "Concentration of Various Enyzmes Before and After Treatment")
Created on 2022-01-08 by the reprex package (v2.0.1)
Note: Next time please provide a proper REPRoducible EXample (reprex) illustrating your issue.