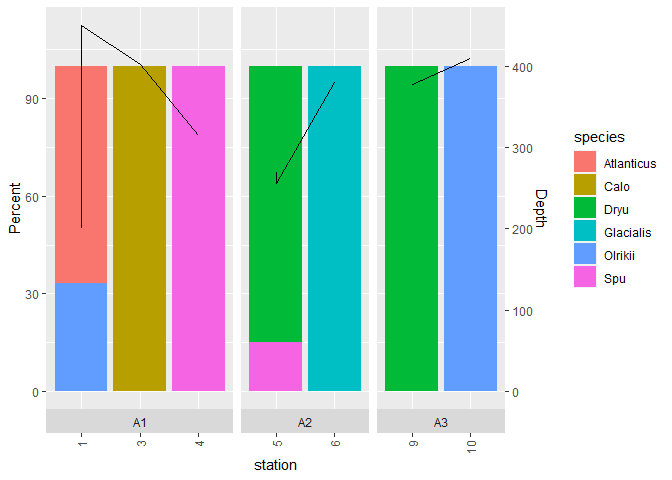
This is the plot I can make with your most recent data. I do not know how to get a line to go from one facet to the next.
library(tidyverse)
#> Warning: package 'tibble' was built under R version 4.1.2
df <- tribble(
  ~zone, ~type, ~station, ~species, ~number, ~depth,
  'A1', 'Adult', 1, 'Atlanticus', 2, 200,
  'A1', 'Adult', 1, 'Olrikii', 1, 450,
  'A1', 'Larvae', 2, 'Medius', 5, 345,
  'A1', 'Adult', 3, 'Calo', 8, 402,
  'A1', 'Larvae', 3, 'Pryi', 15, 298,
  'A1', 'Zoo', 4, 'Galk', 2, 336,
  'A1', 'Adult', 4, 'Spu', 9, 315,
  'A2', 'Adult', 5, 'Dryu', 17, 269,
  'A2', 'Adult', 5, 'Spu', 3, 256,
  'A2', 'Larvae', 5, 'Olrikii', 13, 311,
  'A2', 'Zoo', 6, 'Calo', 5, 289,
  'A2', 'Zoo', 6, 'Unidentified', 3, 405,
  'A2', 'Adult', 6, 'Glacialis', 2, 380,
  'A2', 'Larvae', 7, 'Medius', 4, 310,
  'A2', 'Larvae', 7, 'Glou', 7, 269,
  'A3', 'Zoo', 8, 'Capilatta', 17, 265,
  'A3', 'Zoo', 8, 'Calo', 17, 295,
  'A3', 'Adult', 9, 'Dryu', 17, 378,
  'A3', 'Zoo', 9, 'Glou', 17, 368,
  'A3', 'Zoo', 9, 'Azu', 17, 490,
  'A3', 'Adult', 10, 'Olrikii', 1, 410
)

df %>%
  filter(type == "Adult") %>%
  group_by(station) %>%
  mutate(Percent = 100 * number/sum(number),
         station=factor(station)) %>%
  ggplot(aes(station, fill = species)) +
  geom_bar(aes(y = Percent), position = "stack", stat = "identity") +
  geom_line(aes(y = depth /4, group = 1)) +
  scale_y_continuous(sec.axis = sec_axis(~ . * 4, name = "Depth")) +
  theme(axis.text.x = element_text(angle = 90, vjust = 0.5, hjust=1)) +
  #scale_fill_manual(name = "Species", values=PZ) +
  facet_grid(~factor(zone,levels = c("A1","A2","A3")),scale = "free_x", space = "free_x", switch = "x")
Created on 2022-05-31 by the reprex package (v2.0.1)