Is this the sort of thing you are looking for?
library(tidyverse)
#> Warning: package 'tibble' was built under R version 4.1.2
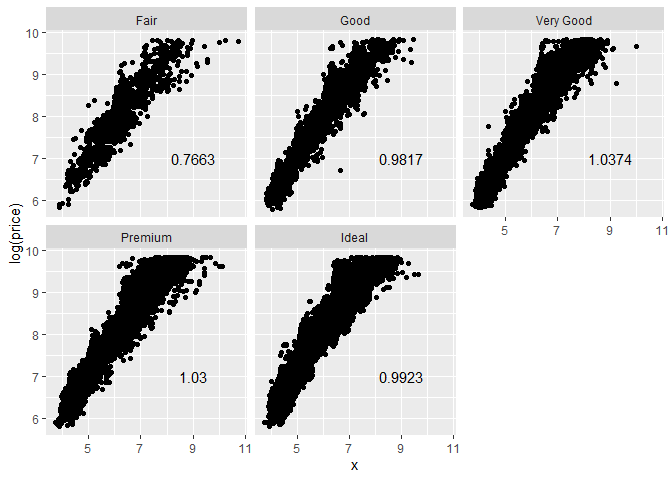
STATS <- diamonds |>
filter(x > 0) |>
group_by(cut) |>
summarise(sd_log_price = sd(log(price))) |>
mutate(sd_log_price = round(sd_log_price,4))
diamonds |>
filter(x > 0) |>
ggplot(aes(x = x, y = log(price))) +
geom_point() +
geom_text(aes(x=9,y=7,label= sd_log_price), data = STATS)+
facet_wrap(. ~ cut)
Created on 2022-02-09 by the reprex package (v2.0.1)